Quote:
Originally Posted by JIMBOB1002

Hi Bill, thanks for posting these races their always very helpful. I think for some reason I'm still a little confused about the segment screen. How can you tell #3 and #4 are still in the lead after F2. You had stated add F1 and F2 not sure what your meaning by that. Thanks Jim
|
Hi Jim
Thats the basis of the match up
The problem with just using a horses EP ( second call ) from a paceline
is that races don't start from a gate at the second call. We need to know how they will get to the second call
By using all your tools and doing a visual ESP for every horse in the race
you will know at the second call how the match up stands based on
the horses behavior patterns and early ability at the break and first fraction.
The match up involves finding
how they will get to the EP or second call point in today's race
For RDSS users and users of some other Sartin programs
like Thoromation we have the segments screen
The segments screen is an amazing tool
Ted did a great job because this one screen is actually showing the Match Up
Its really like 6 different screens all in one so you need to under stand
how each little screen is tied together and shows the Match Up in a picture form like the old Thoromation stop action pre plays.
But you must read the
Picture correctly
because this is not how the race will run in the
F2 panel particually
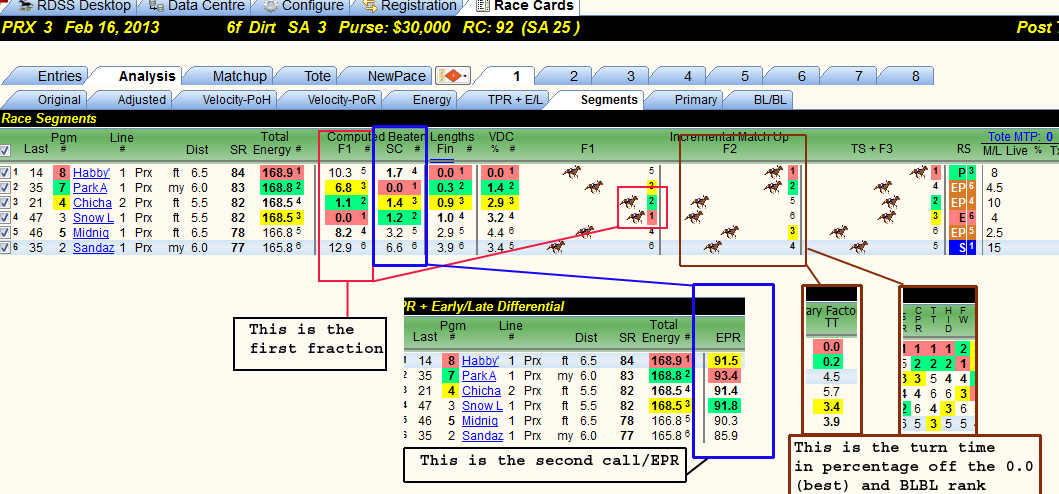
As you can see in the map I have made here
There are 6 small screens but lets just focus on the F1 SC and F1 and F2 portions from left to right
1. The F1 Comp Beaten Lengths
2. The SECOND CALL Computed Beaten Lengths and or The EP Rating on BLBL and Phase 1 ( tpr)
3, The 3rd fraction CBL This is the LP Rating
Then we have 3 more readouts
4. The First Fraction Position of the horses - This is how the horses would take off and hit the wire at the first fraction This is the way RDSS is projecting the first fraction MATCH UP
THIS IS IMPORTANT - This is the only segment preplay that is showing the race in picture form as Thoromation did
5. This is the 2nd Fraction Its the same readout as you see on the Primary line score and Velocity screens for the Second Fraction. The position of the horses is reflecting the moves the horse made in second fraction only
6 This is the 3rd fraction and Total Speed
In today's race the 3 and 4 win the race if the race was just the first fraction By using the 0.0 and percentages from the 0.0
and little horse Icons you can see the 3 and 4 have an advantage
When you look at the EP ratings on the TPR and BLBL screen you will see
that the 7 and 8 are top 2 but races don't start at the second call from another gate
Its how they got to the second call that's makes the Match Up
Looking at the F2 segment yes the 7 and 8 are 1-2 but what happened to
the 3 and 4 this is where the 0.0 percentage numbers come into play
The 7 and 8 made big moves to catch up to the 3 and 4 but the 3 and 4 are still ahead
because they ran just about as well in the second fraction The position of the little horses
is not the way the race will look here, but it can be in other races
You have to look at the 0.0 numbers and the horses in relation to the total race .
I will stop here The 3rd panel is even more complex
it important to learn in small bites.